This segment of the project was focused on building an idea of what the dataset looked like.
By clustering our tweets into several sets, we can determine what a influential tweet looks like.
currently our csv headers look like this:
| date | text | followers | polarity | sentiment_confidence |
|---|---|---|---|---|
Now the problem is how we know what values will be important in determining lead quality.
Intuitively, I decided to drop the text itself, and the date of the Tweets. Because these values were hard to get a quantitative value for in terms of influence. While follower count of the people who posted it, and the polarity of the tweet certainty had influence on the impact of the tweet, these other variables were less directly linked.
After these values were removed, the plot was analyzed for the proper number of clusters. I chose to use an elbow plot to see where the dropoff occurred. The dropoff was less clear than I would have liked, but the graph showed that 5 clusters would be a good match for my kmeans clustering.
For each individual stock, sci-kit learn was used to cluster and graph this clustering.
Below the code is provided with the elbow plot commented out. Samples of the Clustering graph outputs are below that.
cluster.py
import pandas as pd
from scipy import stats
from sklearn.cluster import KMeans
from sklearn.decomposition import PCA
import matplotlib.pyplot as plt
import seaborn as sns
import sys
#from mpl_toolkits.mplot3d import Axes3D
df = pd.read_csv('sentimentdata/'+sys.argv[1]+'sentiment.csv',index_col=0,
encoding='latin-1')
dfold = df
df = df.drop('text', 1)
print(df.head())
df = df.drop('date', 1)
print(df.head())
df_tr = df
# select proper number of clusters
'''
Y = df[['followers']]
X = df[['polarity']]
Nc = range(1, 20)
kmeans = [KMeans(n_clusters=i) for i in Nc]
score = [kmeans[i].fit(Y).score(Y) for i in range(len(kmeans))]
plt.plot(Nc,score)
plt.xlabel('Number of Clusters')
plt.ylabel('Score')
plt.title('Elbow Curve')
plt.show()
'''
# elbow plot showed the point of dropoff to be around 5 clusters
#Standardize
clmns = ['followers', 'polarity', 'sentiment_confidence']
df_tr_std= stats.zscore(df_tr[clmns])
#Clustering
kmeans = KMeans(n_clusters=5, random_state=0).fit(df_tr_std)
labels = kmeans.labels_
#Glue back to original data
df_tr['clusters']=labels
dfold['clusters']=labels
clmns.extend(['clusters'])
print(df_tr[clmns].groupby(['clusters']).mean())
#Scatter plot of polarity and confidence
sns.lmplot('polarity', 'sentiment_confidence',
data=df_tr,
fit_reg=False,
hue="clusters",
scatter_kws={"marker": "D",
"s": 20})
dfold.to_csv('clusterdata/'+sys.argv[1]+'cluster.csv')
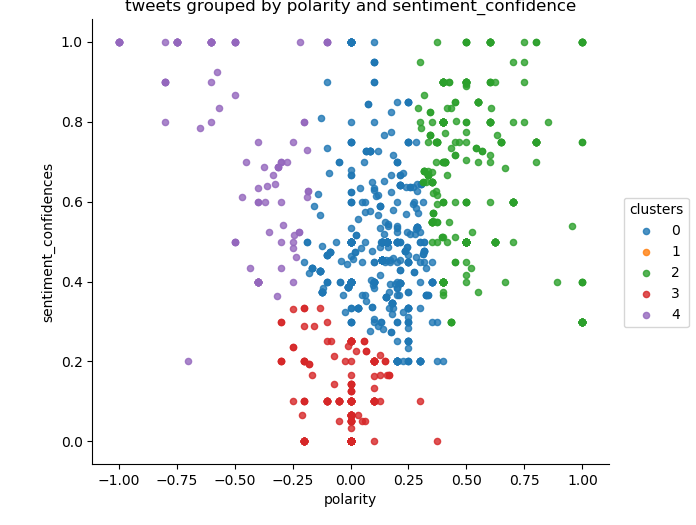
plt.title('tweets grouped by polarity and sentiment_confidence')
plt.xlabel('polarity')
plt.ylabel('sentiment_confidences')
plt.show()
amazon clustering
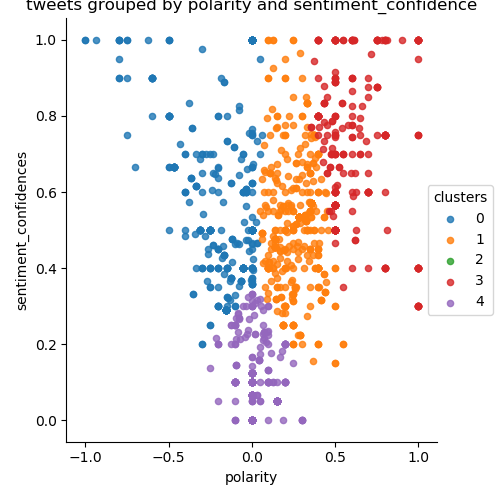
apple clustering
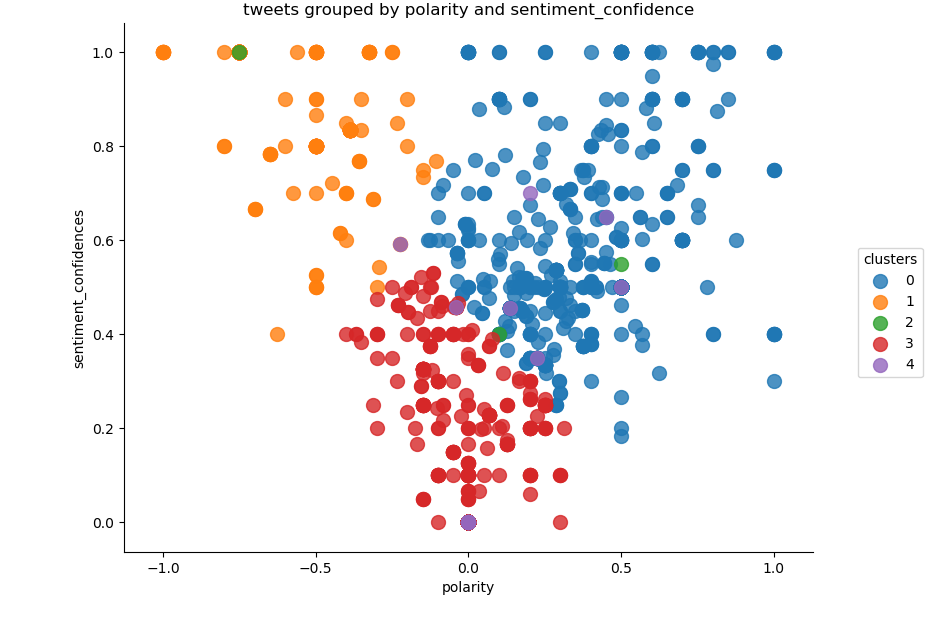
microsoft clustering